 INSPIRE-1
Topic
economy
173 record(s)
Provided by
Type of resources
Available actions
Topics
Keywords
Contact for the resource
Update frequencies
-
-
The SuK-Nord (INSPIRE) shows the geological distribution of aggregates (sand and gravel) in Northern Germany, especially north of the southernmost maximum of the Scandinavian inland ice sheet (Saalian and Elsterian glaciation). According to the Data Specifications on Mineral Resources (D2.8.III.21) and Geology (D2.8.II.4_v3.0) the content of the map is stored in two INSPIRE-compliant GML files: SuK_Nord_EarthResource_polygon.gml contains the distribution of aggreagtes (sand and gravel) as polygons. SuK_Nord_GeomorphologicFeature.gml contains the southernmost maximum of the Scandinavian inland ice sheet (Saalian and Elsterian glaciation) as lines. The GML files together with a Readme.txt file are provided in ZIP format (SuK_Nord-INSPIRE.zip). The Readme.text file (German/English) contains detailed information on the GML files content. Data transformation was proceeded by using the INSPIRE Solution Pack for FME according to the INSPIRE requirements.
-

-
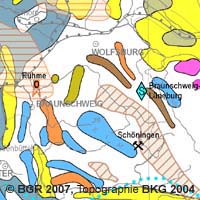
The Map of Mineral Resources of Germany 1: 1,000,000 (BSK1000) provides the basic information on the spatial distribution of energy resources and mineral raw materials (‘stones and earth’, industrial minerals and ores) in Germany. The mineral resources are summarized in commodity groups, represented as different colored units. The back of the map contains information about the definition, creation, important deposits, use and economic significance of all the raw materials shown. The map is published by the Federal Institute for Geosciences and Natural Resources in cooperation with the National Geological Surveys.
-
-
Die Karte zeigt die mittlere Turbulenzintensität in 160 m Höhe über Grund. Die mittlere Turbulenzintensität beschreibt den Strömungszustand der Luft, der durch die Entstehung und den Zerfall von Wirbeln gekennzeichnet ist. Sie wird in Prozent angegeben und bezieht sich immer auf die mittlere Windgeschwindigkeit am Standort.
-
Die Karte zeigt die durchschnittliche Windgeschwindigkeit in 120 m Höhe über Grund als Mittelwert von 2001 bis 2020 in einer Auflösung von 10 x 10 m.
-
Biogasanlagen im Kreis Herzogtum Lauenburg
-
Betriebe unter Bergaufsicht im Saarland, Tiefbau, Steinkohle, Einwirkungsbereiche Tiefer Abbau, Höhenlage, Bundesberggesetz (BBergG)
-
Die Karte zeigt die mittlere Turbulenzintensität in 140 m Höhe über Grund. Die mittlere Turbulenzintensität beschreibt den Strömungszustand der Luft, der durch die Entstehung und den Zerfall von Wirbeln gekennzeichnet ist. Sie wird in Prozent angegeben und bezieht sich immer auf die mittlere Windgeschwindigkeit am Standort.