 INSPIRE-1
Contact for the resource
German Aerospace Center (DLR)
26 record(s)
Provided by
Type of resources
Available actions
Topics
Keywords
Contact for the resource
Update frequencies
Service types
-
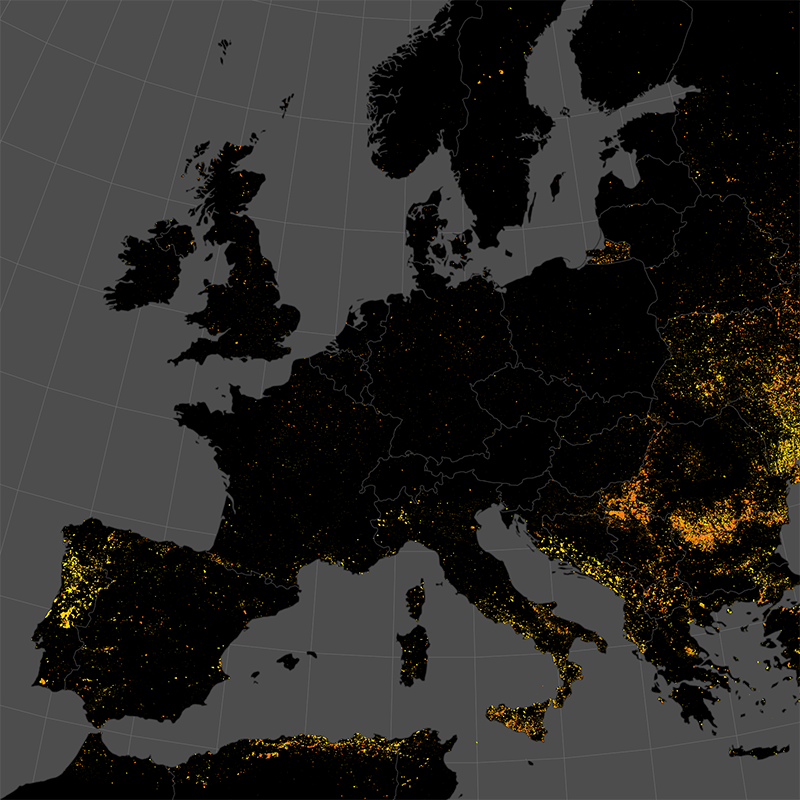
This data set represents the monthly, accumulated results of the final (10-day) version of the fire perimeters from the "Burnt Area Daily NRT Incremental Product - Europe, Sentinel-3" dataset. The burn perimeters are spatially and temporally correlated, so that interrelated detections from consecutive observations are combined into a single feature. A perimeter is interpreted as belonging to a given event if a spatial overlap exists within a time frame of 15 days. Besides the geometry, attribute information is also combined while considering the size of the perimeter as a weighting factor. Each feature contains information about the final fire perimeter, Date/Time of the first detection, and the averaged burn severity.
-

The product is automatically derived from Sentinel-3 (OLCI) satellite imagery in near-real time. It is an incremental product, meaning that the retrieved results are updated as soon as new input data becomes available over a timespan of ten days. Besides the fire perimeter, and detection time each feature contains information about the severity of the burning.
-

The product is automatically derived from Aqua/Terra (MODIS) satellite imagery in near-real time. It is an incremental product, meaning that the retrieved results are updated as soon as new input data becomes available over a timespan of ten days. Besides the fire perimeter and detection time, each feature contains information about the severity of the burning.
-

This data set represents the yearly, accumulated results of the final (10-day) version of the fire perimeters from the "Burnt Area Daily NRT Incremental Product - Europe, Sentinel-3" dataset. The burn perimeters are spatially and temporally correlated, so that interrelated detections from consecutive observations are combined into a single feature. A perimeter is interpreted as belonging to a given event if a spatial overlap exists within a time frame of 15 days. Besides the geometry, attribute information is also combined while considering the size of the perimeter as a weighting factor. Each feature contains information about the final fire perimeter, Date/Time of the first detection, and the averaged burn severity
-
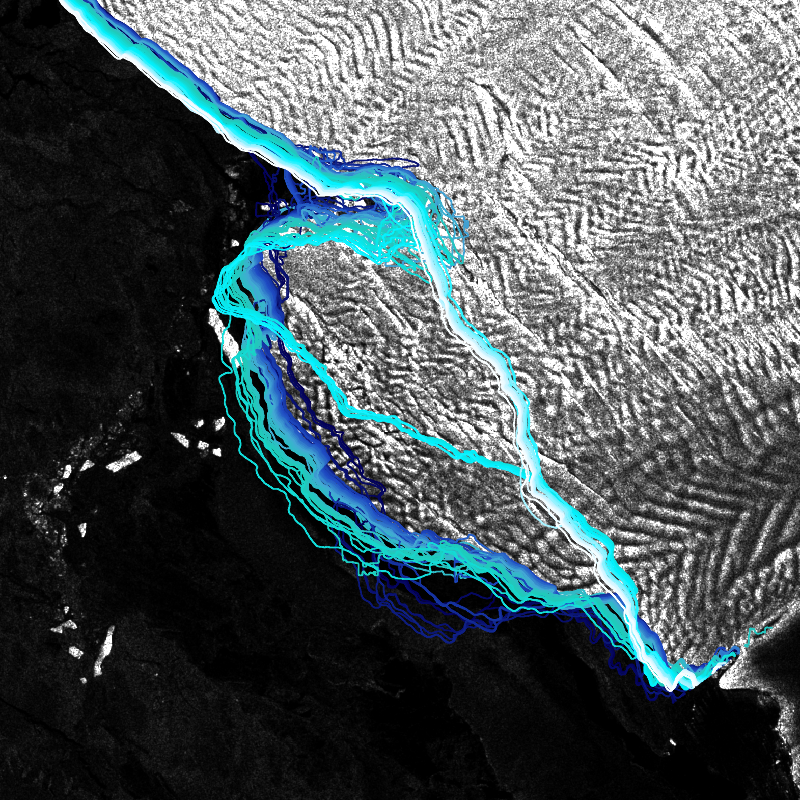
IceLines (Ice Shelf and Glacier Front Time Series) is an automated calving front monitoring service providing monthly ice shelf front time series of major Antarctic ice shelves. The provided time series allows to discover the dynamics of ice shelf front changes and calving events. The front positions are automatically derived from Sentinel-1 data based on a deep neuronal network called HED-U-Net. The time series covers the timespan 2014 to today (partly limited due to Sentinel-1 data availability). Incorrectly extracted fronts are truncated which might lead to gaps in the time series especially between December to March due to strong surface melt. Annual averages are calculated based on the extracted monthly fronts (excluding the summer months) and provide more robust results due to temporal aggregation
-
This WMS provides access to different elevation products provided by the Earth Observation Center (EOC) of the DLR.
-
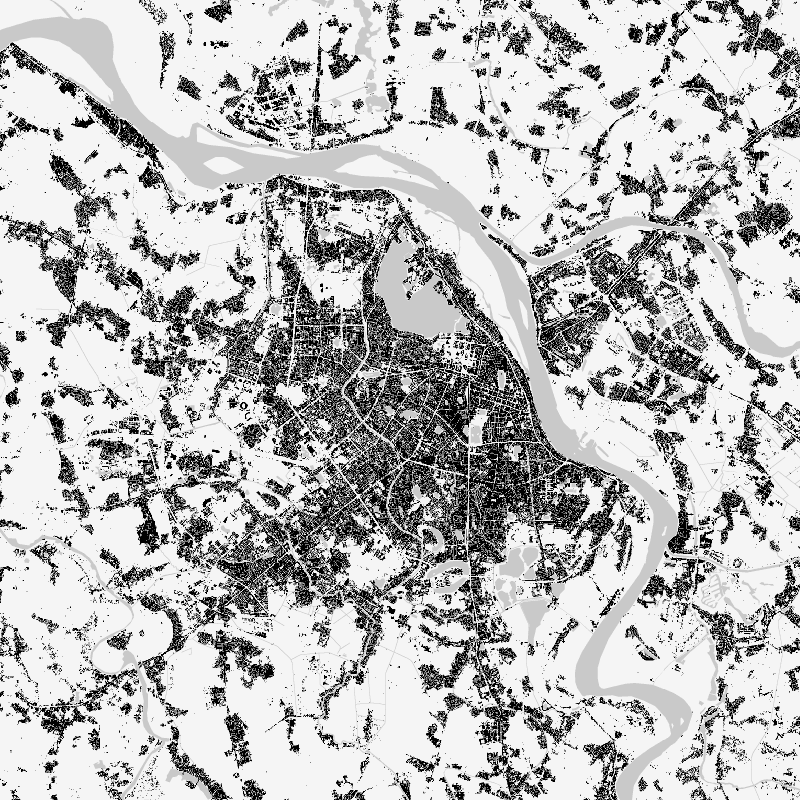
The World Settlement Footprint (WSF) 2019 is a 10m resolution binary mask outlining the extent of human settlements globally derived by means of 2019 multitemporal Sentinel-1 (S1) and Sentinel-2 (S2) imagery. Based on the hypothesis that settlements generally show a more stable behavior with respect to most land-cover classes, temporal statistics are calculated for both S1- and S2-based indices. In particular, a comprehensive analysis has been performed by exploiting a number of reference building outlines to identify the most suitable set of temporal features (ultimately including 6 from S1 and 25 from S2). Training points for the settlement and non-settlement class are then generated by thresholding specific features, which varies depending on the 30 climate types of the well-established Köppen Geiger scheme. Next, binary classification based on Random Forest is applied and, finally, a dedicated post-processing is performed where ancillary datasets are employed to further reduce omission and commission errors. Here, the whole classification process has been entirely carried out within the Google Earth Engine platform. To assess the high accuracy and reliability of the WSF2019, two independent crowd-sourcing-based validation exercises have been carried out with the support of Google and Mapswipe, respectively, where overall 1M reference labels have been collected based photointerpretation of very high-resolution optical imagery.
-

The TROPOMI instrument onboard the Copernicus SENTINEL-5 Precursor satellite is a nadir-viewing, imaging spectrometer that provides global measurements of atmospheric properties and constituents on a daily basis. It is contributing to monitoring air quality and climate, providing critical information to services and decision makers. The instrument uses passive remote sensing techniques by measuring the top of atmosphere solar radiation reflected by and radiated from the earth and its atmosphere. The four spectrometers of TROPOMI cover the ultraviolet (UV), visible (VIS), Near Infra-Red (NIR) and Short Wavelength Infra-Red (SWIR) domains of the electromagnetic spectrum. The operational trace gas products generated at DLR on behave ESA are: Ozone (O3), Nitrogen Dioxide (NO2), Sulfur Dioxide (SO2), Formaldehyde (HCHO), Carbon Monoxide (CO) and Methane (CH4), together with clouds and aerosol properties. This product displays the Nitrogen Dioxide (NO2) near surface concentration for Germany and neighboring countries as derived from the POLYPHEMUS/DLR air quality model. Surface NO2 is mainly generated by anthropogenic sources, e.g. transport and industry. POLYPHEMUS/DLR is a state-of-the-art air quality model taking into consideration - meteorological conditions, - photochemistry, - anthropogenic and natural (biogenic) emissions, - TROPOMI NO2 observations for data assimilation. This Level 4 air quality product (surface NO2 at 15:00 UTC) is based on innovative algorithms, processors, data assimilation schemes and operational processing and dissemination chain developed in the framework of the INPULS project. The DLR project INPULS develops (a) innovative retrieval algorithms and processors for the generation of value-added products from the atmospheric Copernicus missions Sentinel-5 Precursor, Sentinel-4, and Sentinel-5, (b) cloud-based (re)processing systems, (c) improved data discovery and access technologies as well as server-side analytics for the users, and (d) data visualization services.
-
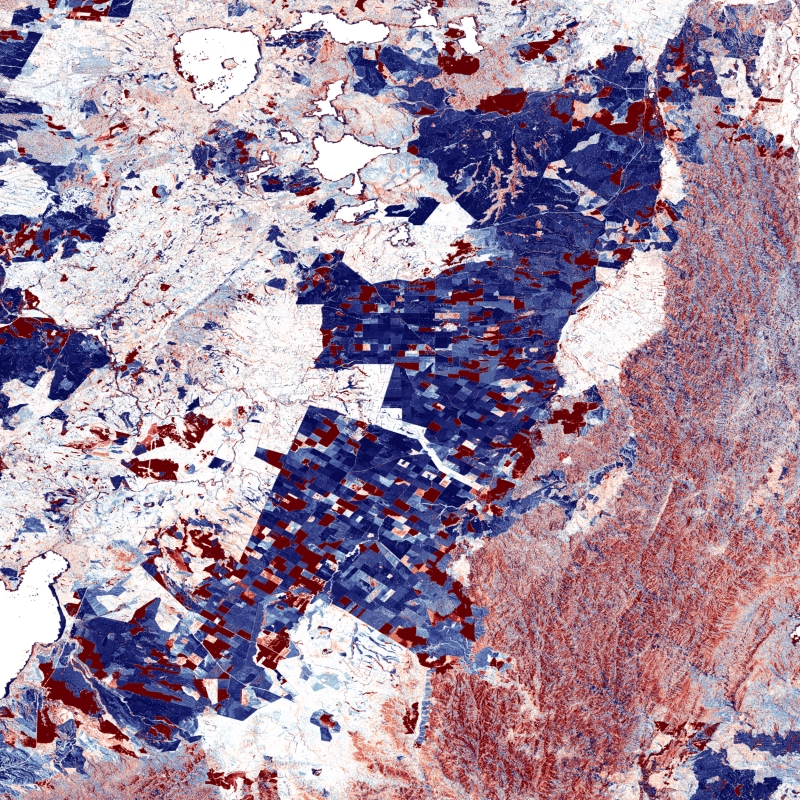
The TanDEM-X DEM Change Maps is a project developed by the Institute Remote Sensing Technology (IMF) at the German Aerospace Center (DLR) within the activities of the TanDEM-X Mission. Between 2016 and 2022, the TanDEM-X mission acquired an additional complete coverage of the Earth's landmass to deliver a temporally independent coverage within a well-defined time span. These new acquisitions not only provide more up-to-date elevation information, but also a great dataset to show the changes that have occurred during the years separating this new coverage from the coverages acquired to generate the TanDEM-X global DEM (between 2011 and 2014). This product - the TanDEM-X 30 m DEM Change Maps - shows the changes between the edited first global TanDEM-X DEM (TanDEM-X 30m Edited DEM) and the newly acquired time-tagged DEM scenes. In order to keep a unique timestamp, two change maps are available per tile: one with the change to the oldest pixel in the new dataset - the first DEM change, and another with the change to the newest pixel of the new dataset - the last DEM change. The two maps differ only when there are multiple coverages. Users must be aware that a given elevation change measured in the DEM change maps corresponds to a topographic change with respect to TanDEM-X 30m EDEM, but cannot be associated with a corresponding physical height change of the same magnitude. This is due to the fact that the global TanDEM-X DEM reflects an averaged elevation derived from the combination of different images, acquired over a period of several years but also because the radar waves penetrate differently in the surface depending on the attributes of the land cover. This is especially important over vegetated and snow-covered regions.
-
The World Settlement Footprint WSF 2015 version 2 (WSF2015 v2) is a 10m resolution binary mask outlining the extent of human settlements globally for the year 2015. Specifically, the WSF2015 v2 is a pilot product generated by combining multiple datasets, namely: • The WSF2015 v1 derived at 10m spatial resolution by means of 2014-2015 multitemporal Landsat-8 and Sentinel-1 imagery (of which ~217K and ~107K scenes have been processed, respectively); https://doi.org/10.1038/s41597-020-00580-5 • The High Resolution Settlement Layer (HRSL) generated by the Connectivity Lab team at Facebook through the employment of 2016 DigitalGlobe VHR satellite imagery and publicly released at 30m spatial resolution for 214 countries; https://arxiv.org/pdf/1712.05839.pdf • The novel WSF2019 v1 derived at 10m spatial resolution by means of 2019 multitemporal Sentinel-1 and Sentinel-2 imagery (of which ~ 1.2M and ~1.8M scenes have been processed, respectively); https://doi.org/10.1553/giscience2021_01_s33 The WSF2015 v1 demonstrated to be highly accurate, outperforming all similar existing global layers; however, the use of Landsat imagery prevented a proper detection of very small structures, mostly due to their reduced scale. Based on an extensive qualitative assessment, wherever available the HRSL layer shows instead a systematic underestimation of larger settlements, whereas it proves particularly effective in identifying smaller clusters of buildings down to single houses, thanks to the employment of 2016 VHR imagery. The WSF2015v v2 has been then generated by: i) merging the WSF2015 v1 and HRSL (after resampling to 10m resolution and disregarding the population density information attached); and ii) masking the outcome by means of the WSF2019 product, which exhibits even higher detail and accuracy, also thanks to the use of Sentinel-2 data and the proper employment of state-of-the-art ancillary datasets (which allowed, for instance, to effectively mask out all roads globally from motorways to residential).