 INSPIRE-1
Topic
climatologyMeteorologyAtmosphere
154 record(s)
Provided by
Type of resources
Available actions
Topics
Keywords
Contact for the resource
Update frequencies
-
calculated values for potential Evaporation over gras at DWD stations in the Regional Basic Synoptic Network of the WMO, plus additional stations from the so called "Global Dataset" of DWD
-
Grids are derived from DWD stations and legally and equivalent partner stations in Germany.
-
wind speed measurements at DWD stations in the Regional Basic Synoptic Network of the WMO, plus additional stations from the so called "Global Dataset" of DWD
-
Grids are derived from DWD stations and legally and qualitatively equivalent partner stations in Germany.
-

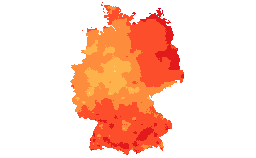
The TROPOMI instrument onboard the Copernicus SENTINEL-5 Precursor satellite is a nadir-viewing, imaging spectrometer that provides global measurements of atmospheric properties and constituents on a daily basis. It is contributing to monitoring air quality and climate, providing critical information to services and decision makers. The instrument uses passive remote sensing techniques by measuring the top of atmosphere solar radiation reflected by and radiated from the earth and its atmosphere. The four spectrometers of TROPOMI cover the ultraviolet (UV), visible (VIS), Near Infra-Red (NIR) and Short Wavelength Infra-Red (SWIR) domains of the electromagnetic spectrum. The operational trace gas products generated at DLR on behave ESA are: Ozone (O3), Nitrogen Dioxide (NO2), Sulfur Dioxide (SO2), Formaldehyde (HCHO), Carbon Monoxide (CO) and Methane (CH4), together with clouds and aerosol properties. This product displays the Nitrogen Dioxide (NO2) near surface concentration for Germany and neighboring countries as derived from the POLYPHEMUS/DLR air quality model. Surface NO2 is mainly generated by anthropogenic sources, e.g. transport and industry. POLYPHEMUS/DLR is a state-of-the-art air quality model taking into consideration - meteorological conditions, - photochemistry, - anthropogenic and natural (biogenic) emissions, - TROPOMI NO2 observations for data assimilation. This Level 4 air quality product (surface NO2 at 15:00 UTC) is based on innovative algorithms, processors, data assimilation schemes and operational processing and dissemination chain developed in the framework of the INPULS project. The DLR project INPULS develops (a) innovative retrieval algorithms and processors for the generation of value-added products from the atmospheric Copernicus missions Sentinel-5 Precursor, Sentinel-4, and Sentinel-5, (b) cloud-based (re)processing systems, (c) improved data discovery and access technologies as well as server-side analytics for the users, and (d) data visualization services.
-
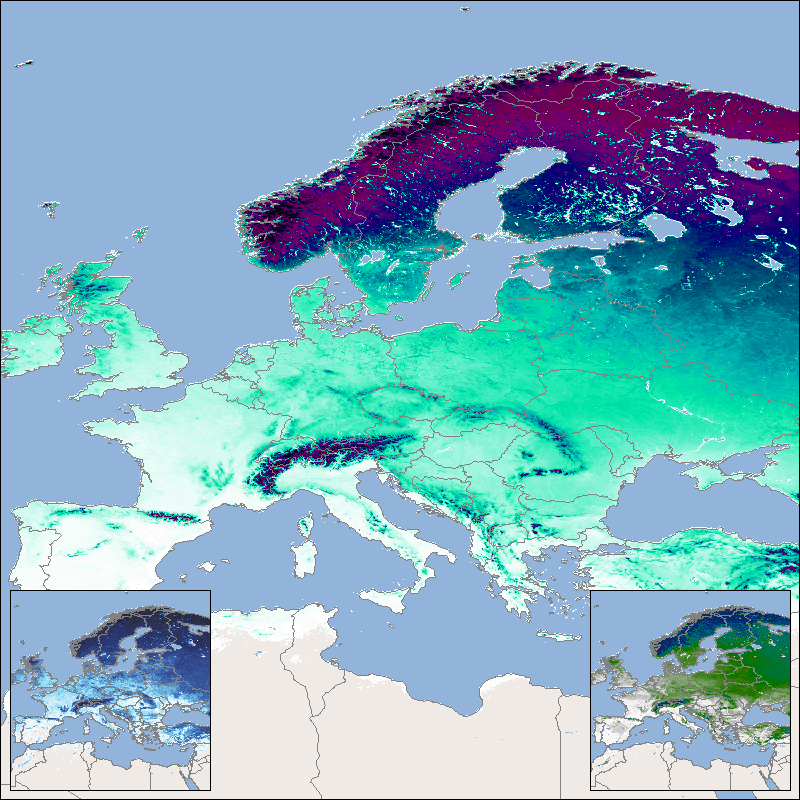
This product shows the mean snow cover duration (SCDmean), which is updated each year and consists of the arithmetic mean for the entire time series since the hydrological year 2001. The hydrological year begins in the meteorological autumn (October 1 of the previous year in the northern hemisphere or March 1 of the reference year in the southern hemisphere) and ends with the meteorological summer (northern hemisphere: August 31 of the reference year; southern hemisphere: February 28/29 of the following year). Analogous to the annual products for snow cover duration, the entire year as well as the early season (until mid-winter) and the late season (from mid-winter) are taken into account here. The “Global SnowPack” is derived from daily, operational MODIS snow cover product for each day since February 2000. Data gaps due to polar night and cloud cover are filled in several processing steps, which provides a unique global data set characterized by its high accuracy, spatial resolution of 500 meters and continuous future expansion. It consists of the two main elements daily snow cover extent (SCE) and seasonal snow cover duration (SCD; full and for early and late season). Both parameters have been designated by the WMO as essential climate variables, the accurate determination of which is important in order to be able to record the effects of climate change. Changes in the largest part of the cryosphere in terms of area have drastic effects on people and the environment. For more information please also refer to: Dietz, A.J., Kuenzer, C., Conrad, C., 2013. Snow-cover variability in central Asia between 2000 and 2011 derived from improved MODIS daily snow-cover products. International Journal of Remote Sensing 34, 3879–3902. https://doi.org/10.1080/01431161.2013.767480 Dietz, A.J., Kuenzer, C., Dech, S., 2015. Global SnowPack: a new set of snow cover parameters for studying status and dynamics of the planetary snow cover extent. Remote Sensing Letters 6, 844–853. https://doi.org/10.1080/2150704X.2015.1084551 Dietz, A.J., Wohner, C., Kuenzer, C., 2012. European Snow Cover Characteristics between 2000 and 2011 Derived from Improved MODIS Daily Snow Cover Products. Remote Sensing 4. https://doi.org/10.3390/rs4082432 Dietz, J.A., Conrad, C., Kuenzer, C., Gesell, G., Dech, S., 2014. Identifying Changing Snow Cover Characteristics in Central Asia between 1986 and 2014 from Remote Sensing Data. Remote Sensing 6. https://doi.org/10.3390/rs61212752 Rößler, S., Witt, M.S., Ikonen, J., Brown, I.A., Dietz, A.J., 2021. Remote Sensing of Snow Cover Variability and Its Influence on the Runoff of Sápmi’s Rivers. Geosciences 11, 130. https://doi.org/10.3390/geosciences11030130
-

This product shows globally the daily snow cover extent (SCE). The snow cover extent is the result of the Global SnowPack processor's interpolation steps and all data gaps have been filled. Snow cover extent is updated daily and processed in near real time (3 days lag). In addition to the near real-time product (NRT_SCE), the entire annual data set is processed again after the end of a calendar year in order to close data gaps etc. and the result is made available as a quality-tested SCE product. There is also a quality layer for each day (SCE_Accuracy), which reflects the quality of the snow determination based on the time interval to the next "cloud-free" day, the time of year and the topographical/geographical location. The “Global SnowPack” is derived from daily, operational MODIS snow cover product for each day since February 2000. Data gaps due to polar night and cloud cover are filled in several processing steps, which provides a unique global data set characterized by its high accuracy, spatial resolution of 500 meters and continuous future expansion. It consists of the two main elements daily snow cover extent (SCE) and seasonal snow cover duration (SCD; full and for early and late season). Both parameters have been designated by the WMO as essential climate variables, the accurate determination of which is important in order to be able to record the effects of climate change. Changes in the largest part of the cryosphere in terms of area have drastic effects on people and the environment. For more information please also refer to: Dietz, A.J., Kuenzer, C., Conrad, C., 2013. Snow-cover variability in central Asia between 2000 and 2011 derived from improved MODIS daily snow-cover products. International Journal of Remote Sensing 34, 3879–3902. https://doi.org/10.1080/01431161.2013.767480 Dietz, A.J., Kuenzer, C., Dech, S., 2015. Global SnowPack: a new set of snow cover parameters for studying status and dynamics of the planetary snow cover extent. Remote Sensing Letters 6, 844–853. https://doi.org/10.1080/2150704X.2015.1084551 Dietz, A.J., Wohner, C., Kuenzer, C., 2012. European Snow Cover Characteristics between 2000 and 2011 Derived from Improved MODIS Daily Snow Cover Products. Remote Sensing 4. https://doi.org/10.3390/rs4082432 Dietz, J.A., Conrad, C., Kuenzer, C., Gesell, G., Dech, S., 2014. Identifying Changing Snow Cover Characteristics in Central Asia between 1986 and 2014 from Remote Sensing Data. Remote Sensing 6. https://doi.org/10.3390/rs61212752 Rößler, S., Witt, M.S., Ikonen, J., Brown, I.A., Dietz, A.J., 2021. Remote Sensing of Snow Cover Variability and Its Influence on the Runoff of Sápmi’s Rivers. Geosciences 11, 130. https://doi.org/10.3390/geosciences11030130
-
precipitation measurements at DWD stations in the Regional Basic Synoptic Network of the WMO, plus additional stations from the so called "Global Dataset" of DWD
-

2m temperature measurements at DWD stations in the Regional Basic Synoptic Network of the WMO, plus additional stations from the so called "Global Dataset" of DWD
-
relative humidity measurements at DWD stations in the Regional Basic Synoptic Network of the WMO, plus additional stations from the so called "Global Dataset" of DWD